CATEGORY · 예측
고성능 소셜 네트워크 분석 기반
고객 관계·라이프 니즈 ‘예측’ 플랫폼
웹 기반 대규모 그래프 연산으로 고객과 커뮤니티의 연결 구조를 탐색하고, 잠재 관계와 라이프 니즈를 이해하는 분석 기반을 제공합니다.
개인 속성을 넘어 관계 맥락으로
관심사·활동·커뮤니티를 관계망으로 표현하면 고객을 둘러싼 집단과 연결 구조를 함께 이해할 수 있습니다.
관계에서 라이프 니즈 신호로
커뮤니티와 잠재 연결을 분석해 고객 접점과 맞춤형 서비스 기획에 활용할 관계 기반 신호를 탐색합니다.
고성능 분석을 쉬운 웹 경험으로
데이터 준비부터 관계 분석, 결과 탐색까지 하나의 웹 흐름으로 연결합니다.
COMMUNITY MATCHING
관계 집단·커뮤니티 탐색
연결이 밀집된 구조와 주요 노드를 확인해 고객 관계를 집단 단위로 이해할 수 있는 기반을 제공합니다.
POTENTIAL CONNECTION
잠재 관계 후보 예측
공통 이웃과 구조 유사도를 활용해 아직 연결되지 않은 후보와 그 근거를 탐색합니다.
1 Paper Abstract
Sparse generalized matrix-matrix multiplication (SpGEMM) is a fundamental operation for real-world network analysis. With the increasing size of networks, single-machine methods lack scalability due to main memory limits, while distributed systems suffer from heavy inter-machine communication overhead. To address this dilemma, we propose SAGE, a novel storage-based SpGEMM approach that stores graphs in storage (e.g., SSD) and loads only the necessary parts into main memory via a 3-layer architecture, achieving both high scalability and cost-efficiency.
2 Core Challenges & Strategies
- C1. Workload Balancing: Power-law degree distributions cause thread imbalance. SAGE addresses this via Block-based Workload Allocation.
- C2. Intermediate Handling: Massive intermediate results trigger heavy storage I/O. SAGE mitigates this via In-memory Partial Aggregation.
- C3. Memory Management: Fixed buffer structures cause overflows. SAGE solves this with Distribution-aware Memory Allocation.
SAGE 3-Layer Architecture
SAGE effectively coordinates data movement across three tightly coupled layers to optimize intra-machine storage-memory I/Os.
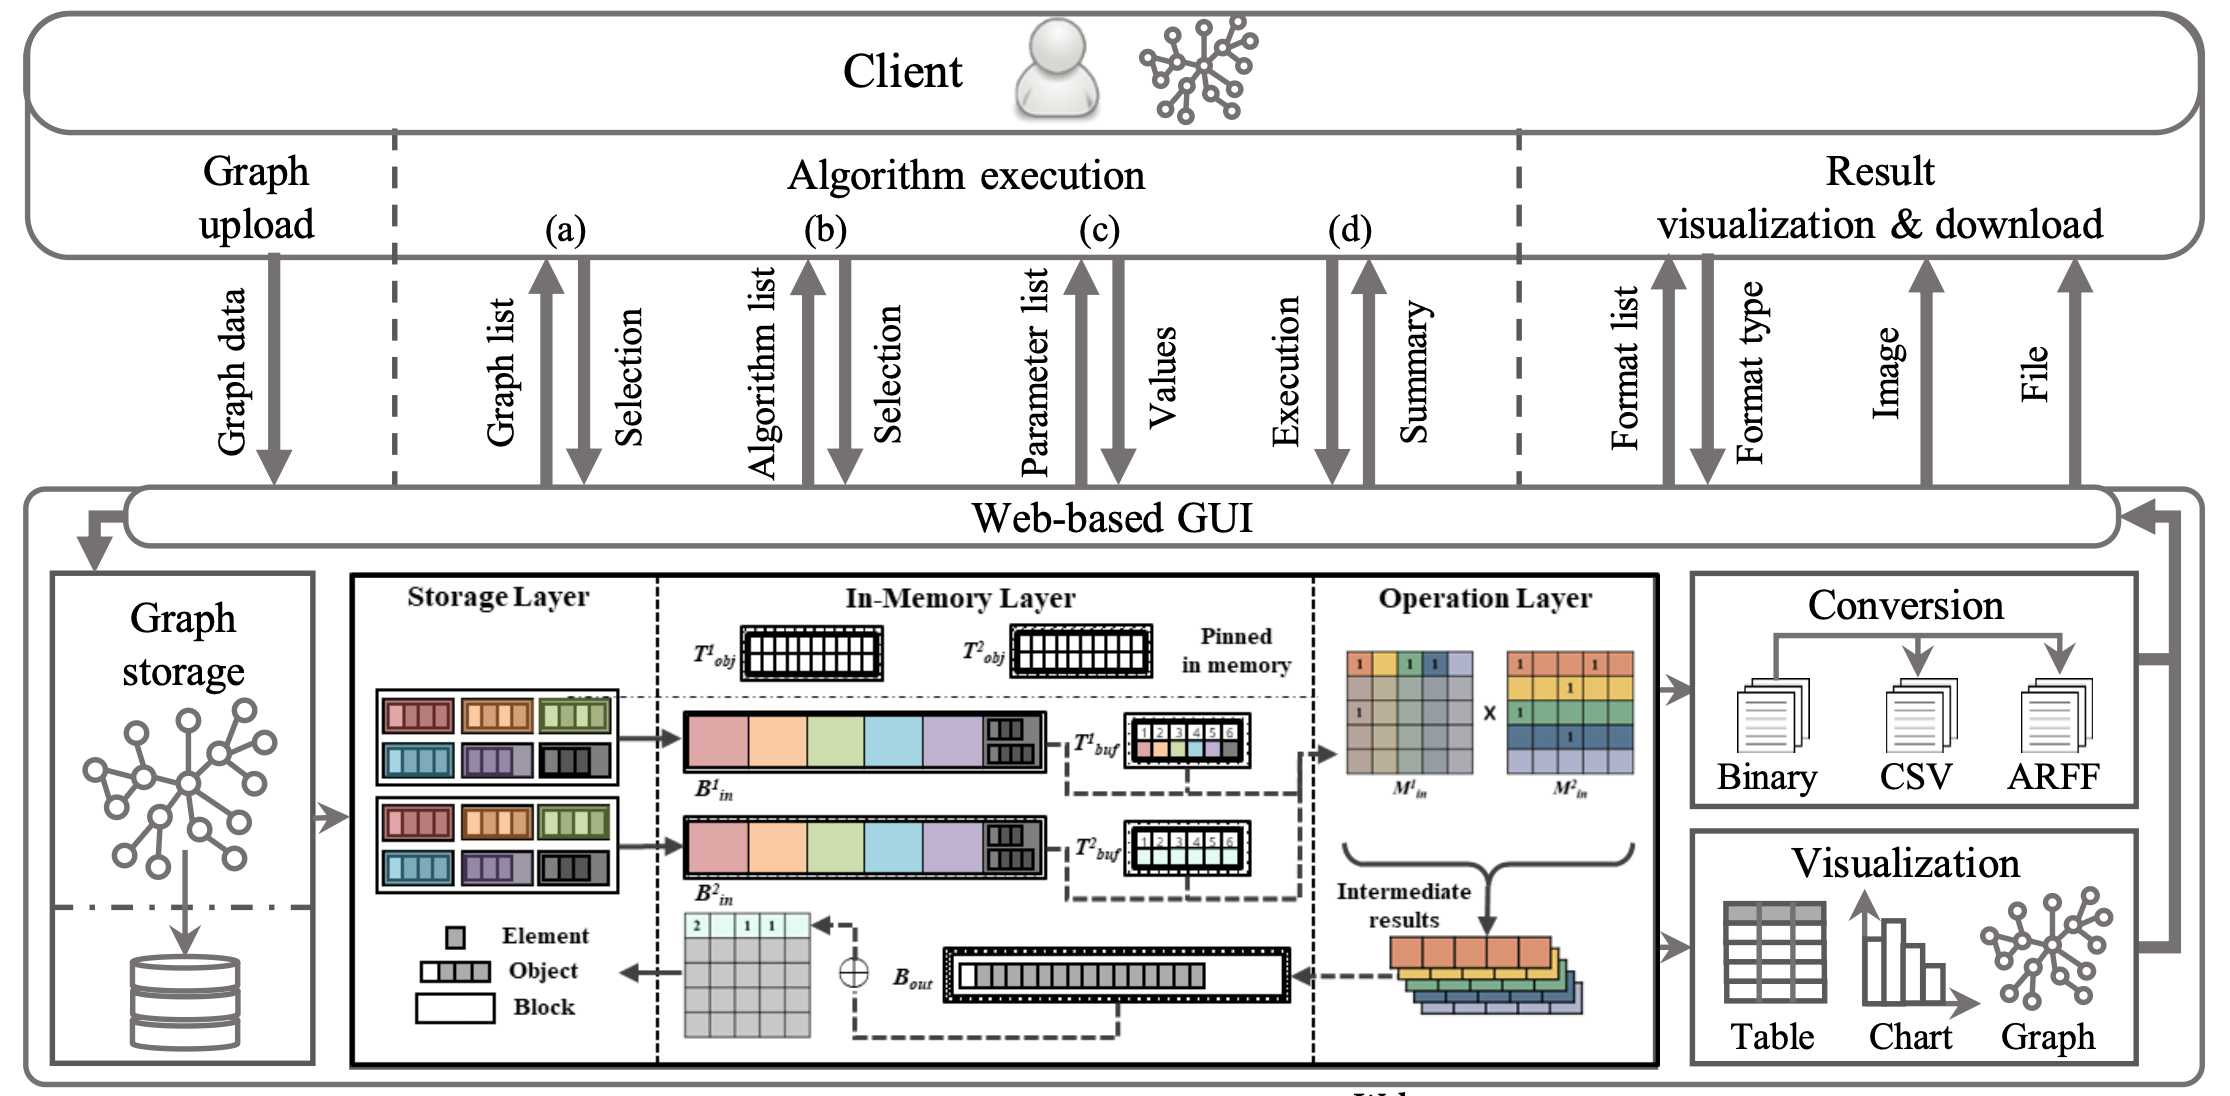 Fig 1. Overview of SAGE with the 3-layer architecture (Storage, In-Memory, and Operation Layers).
Storage Layer
Manages input/output matrices split into fixed-size block units in external storage (SSD).
In-Memory Layer
Handles dynamic block loading, manages index tables (pinned), and performs intermediate partial aggregation.
Operation Layer
Executes multi-threaded row-wise products using data fetched into in-memory buffers.
SAGEWeb Analytics Pipeline
Graph Upload & Format
Upload your target matrix graph. The system formats it into a block-centric structure optimized for storage-based SpGEMM processing.
Algorithm Execution
Configure your execution hyperparameters (GPU processing, buffer size, thread count, and optimization flags) and run the selected graph algorithm via SpGEMM.
Performance & Analysis
Visualize execution time breakdown, storage-memory I/O savings, and compare performance directly with standard in-memory benchmarks.
GRAPH ANALYSIS / 실행 결과
분석 기능과 조건을 설정하세요
1. 데이터셋 선택
2. 분석 기능 선택
고급 실행 설정
> 데이터셋과 분석 기능을 선택해 주세요.
상태: 대기 중